

Your only update duty: check your email. ValidVCE sends every new Qlik Sense Data Architect Certification Exam - 2022 version immediately upon release — 78 practice questions for the QSDA2022 exam, free for 365 days.
Qlik QSDA2022 Exam Overview:
| Certification Vendor: | Qlik |
|---|---|
| Exam Name: | Qlik Sense Data Architect Certification Exam - 2022 |
| Exam Number: | QSDA2022 |
| Passing Score: | 62% |
| Exam Format: | Multiple-choice, Scenario-based |
| Available Languages: | English |
| Exam Price: | $250 USD |
| Certificate Validity Period: | 2 years |
| Real Exam Qty: | 50 |
| Exam Duration: | 120 minutes |
| Related Certifications: | Qlik Sense Business Analyst Qlik Sense System Administrator |
| Recommended Training: | Qlik Continuous Classroom Data Modeling for Qlik Sense (Instructor-Led) |
| Exam Registration: | Qlik Official Exam Page Pearson VUE Registration |
| Sample Questions: |  |
| Exam Way: | Online proctored or onsite testing center via Pearson VUE |
| Pre Condition: | Practical experience building production-grade Qlik Sense applications, writing LOAD scripts, understanding ETL concepts, SQL knowledge, familiarity with QVD architecture |
| Official Syllabus URL: | https://learning.qlik.com/student/page/2161345-qlik-sense-data-architect-certification-exam-details |
Qlik QSDA2022 Exam Syllabus Topics:
| Section | Weight | Objectives |
|---|---|---|
| Topic 1: Data Connectivity | 8% | - Identify required data sources and connectors - Configure and manage data connections |
| Topic 2: Data Model Design | 28% | - Choose appropriate data model architecture - Implement QVD layer architecture - Define measures, attributes and relationships - Optimize model performance and efficiency |
| Topic 3: Identify Requirements | 22% | - Define dimensionality and slowly changing dimensions - Determine metrics, granularity and aggregation - Determine security and access requirements - Identify stakeholders and business requirements |
| Topic 4: Validation | 4% | - Test scripts and data loads - Validate data accuracy and completeness |
| Topic 5: Data Transformations | 38% | - Write and structure LOAD scripts - Organize and document scripts - Handle dates, nulls and complex transformations - Implement incremental loading - Perform data cleansing and formatting |
Qlik Sense Data Architect Certification Exam - 2022 Exam FAQ — Complete Answers
The Qlik Sense Data Architect Certification Exam - 2022 blueprint spans 5 domains — including Data Transformations (38%), Data Connectivity (8%), Identify Requirements (22%). Weightings show where the exam concentrates; the full outline above covers every subtopic.
Through the vendor's official registration channels:
The Qlik Sense Data Architect Certification Exam - 2022 is delivered Online proctored or onsite testing center via Pearson VUE — choose the arrangement that suits you when booking.
$250 USD per attempt, 62% to pass. Every retake bills the full fee, so make practice thorough first — the 78 practice questions for the QSDA2022 exam at ValidVCE are the affordable rehearsal.
Delivery is instant — an automatic email within a minute of payment, unlimited installations, and 24/7 customer assisting for downloading or purchasing problems if nothing arrives within 2 hours. If you fail the corresponding QSDA2022 exam within 60 days of purchase, pick your remedy: a full refund (email a scanned enrollment slip plus the official Score Report PDF within 2 days of the exam; after confirmation, processed within 7 days), waiting for the next updated version free, or a free change to two other equal-value dumps. Excluded: exams within 3 days of purchase, candidate names that don't match the payer, and free or expired products.
Does the vendor offer official training for the Qlik Sense Data Architect Certification Exam - 2022?
Yes:
Training covers theory; interactive practice covers readiness. After any course, rehearse with the 78 practice questions for the Qlik Sense Data Architect Certification Exam - 2022 — every answer expert-verified.
The Qlik Sense Data Architect Certification Exam - 2022 is Qlik's certification exam for Qlik Sense Data Architect, at the Professional level. It demonstrates verified, job-relevant capability to employers. Related credentials include Qlik Sense Business Analyst, Qlik Sense System Administrator.
120 minutes for 50 questions. Rehearse the format interactively: the ValidVCE online engine recreates the test atmosphere, so pacing is trained before it counts.
Yes — a free Qlik Sense Data Architect Certification Exam - 2022 demo is available to download on our exam page. Evaluate the material yourself; purchases include 365 days of free updates, emailed immediately upon release, renewable at 50% off afterward.
Practical experience building production-grade Qlik Sense applications, writing LOAD scripts, understanding ETL concepts, SQL knowledge, familiarity with QVD architecture Eligibility rules change from time to time, so confirm the current requirements on the official page (official QSDA2022 exam page) before booking.
Qlik Sense Data Architect Certification Exam - 2022 Sample Questions:
Refer to the exhibit.
A data architect is working on a Qlik Sense app the business has created to analyze the company orders and shipments. To understand the table structure, the business has given the following summary:
* Every order creates a unique orderlD and an order date in the Orders table
* An order can contain one or more order lines one for each product ID in the order details table
* Products in the order are shipped (shipment date) as soon as tliey are ready and can be shipped separately
* The dates need to be analyzed separately by Year Month, and Quarter
The data architect realizes the data model has issues that must be fixed.
Which steps should the data architect perform?
- A. 1. Create a key with OrderlD and ProductID in the OrderDetails tab e and in the Orders table
2. Delete the ShipmentID in the Shipments table
3. Delete the ProductID and OrderlD in the OrderDetails
4. Left join Orders andOrderDetails
5. Use Derive statement with the MasterCalendar table and apply the derive fields to OrderDate and ShipmentDate - B. 1. Create a key with OrderlD and ProductID in the OrderDeta Is table and in the Shipments table
2. Delete the ShipmentID in the Orders table
3. Delete the ProductID and OrderlD in the Shipmi
4. Left join Orders and OrderDetails
5. Use Derive statement with the MasterCalendar table and apply the derive fields to OrderDateand ShipmentDate - C. 1. Create a key with OrderlD and ProductID in the OrderDetails table and in the Orders table
2. Delete the ShipmentID in the Shipments table
3. Delete the ProductID and OrderlD in theOrderDetails table
4. Concatenate Orders and OrderDetails
5. Create a link table using the MasterCalendar table and create a concatenated field between OrderDate and ShipmentDate - D. 1. Create a key with OrderlD and ProductID in the OrderDetails table and in the Shipments table
2. Delete the ShipmentID in the Orders table
3 Delete the ProductID and OrderlD in the Shipments table
4. Concatenate Orders and OrderDetails
Correct Answer: D 🗳️
Refer to the exhibit.
A business department is forecasting revenue within an Excel spreadsheet.
A data architect needs to include this forecast into the existing data model, and without losing any data.
Which two sets of steps will meet these requirements? (Select two.)
- A. 1. Load the Excel spreadsheet using the data load editor
2. Use the Unpivot function
3 Use the Sum function to group the forecast by date
4 Connect to the existing data model - B. 1 Load the Excel spreadsheet using the data load editor
2. Change the sort order by date
3. Create a composite key out of the forecast and region 4 Connect to the existing data model - C. 1. Load the Excel spreadsheet using the data load editor
2 Use the Crosstable function to unpivot the table
3 Create a composite key out of the date and region
4 Connect the new table to the data model - D. 1 Load the Excel spreadsheet into the data manager
2. Use the Unpivot function
3. Create a composite key from the date and region
4. Connect the new table to the data model
1 Load the Excel spreadsheet using the data manager
2 Rename the ForecastDate field to Date 3. Disable the Region
4 Connect to the existing data model
Correct Answer: C,D 🗳️
Explanation: Only visible for ValidVCE members. You can sign-up / login (it's free).
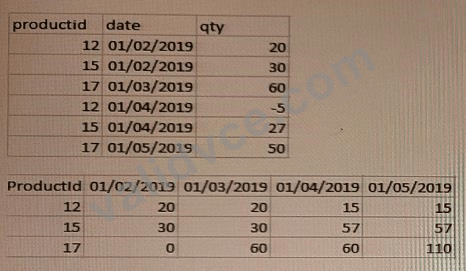
Refer to the exhibits.
The first table shows the source table (Original table).
This data represents the stocks stored every month for each product:
* The relevant fields are productid, qty, and date.
* The date field represents the calendar months using
* The qty field shows the product stock fluctuation from the current month versus the previous month. If there is no fluctuation between months, there are no new entries in the table.
The second table shows a Pivot table visualization the data analyst needs to create in the app displaying per each product the monthly trend of available stock.
For performance reasons, the data analyst requests the data architect to calculate the running stock quantity of each product for every month in the script.
Which approach should the data architect use?
- A. 1 Generate a Calendar table with all dates between the minimum and maximum date values in an Original table
2. LEFT JOIN the Calendar table back to the Original table to populate the missing qty values - B. 1. Generate a Cartesian JOIN between productid and date in a Combined table
2. LEFT JOIN the Combined table with theOriginal table to populate the missing qty values
3. Use PREVIOUSO and SUM() functions to create the running quantity totals for each product for every month - C. 1 Generate a Cartesian JOIN between productid and date in a Combined table
2 RIGHT JOIN the Combined table with the Original table to populate the missing qty values
3. Use PREVIOUS() and RANGESUMQ functions to create the running quantity totals for each product for every month - D. 1. Generate a Calendar table with all dates between the minimum and maximum date values in an Original table
2. RIGHT JOIN the Calendar table back to the Original table to populate the missing qty values
3. Use PEEK() and RANGECOUNTO functions to create the running quantity totals for each product for every month
Correct Answer: A 🗳️
A data architect needs to efficiently prepare a data model for a meeting in an hour.
The data source to be used contains five date fields The app needs to display sales trends and compare the current year to date (CYTD) to last year to date (LYTD) The appis NOT going to be published It will only be used for this meeting and a single user's ad-hoc analysis.
What should the data architect do to meet these requirements?
- A. Use the data manager
- B. Create five master calendars
- C. Create a canonical calendar
- D. Load a calendar island
Correct Answer: C 🗳️
A data architect is developing an app that will generate QVDs for multiple business analysts. The field naming conventions on the source data are NOT business friendly. For every table loaded, multiple fields will require a name change.
An Excel file is maintained centrally that lists all source data field names and the appropriate names as they should appear in the QVDs Which strategy should the data architect use to meet these requirements?
- A. Load in the Excel file as a data island and use the Peek function
- B. Use the Rename function and a mapping load
- C. Use the Alias function and a mapping load
- D. Create master items using business-friendly names
Correct Answer: B 🗳️
Explanation: Only visible for ValidVCE members. You can sign-up / login (it's free).


 988 Customer Reviews


