

Reliable DP-500 Dumps Questions Available as Web-Based Practice Test Engine
Correct and Up-to-date Microsoft DP-500 BrainDumps
Microsoft DP-500 exam is a certification exam offered by Microsoft to individuals who are seeking to become certified in designing and implementing enterprise-scale analytics solutions using Microsoft Azure and Microsoft Power BI. DP-500 exam is designed to test the candidate's skills and knowledge in various areas related to analytics solutions design and implementation.
NEW QUESTION # 70
You are creating an external table by using an Apache Spark pool in Azure Synapse Analytics. The table will contain more than 20 million rows partitioned by date. The table will be shared with the SQL engines.
You need to minimize how long it takes for a serverless SQL pool to execute a query data against the table.
In which file format should you recommend storing the table data?
- A. Apache Parquet
- B. Delta
- C. JSON
- D. CSV
Answer: A
Explanation:
Explanation
Prepare files for querying
If possible, you can prepare files for better performance:
* Convert large CSV and JSON files to Parquet. Parquet is a columnar format. Because it's compressed, its file sizes are smaller than CSV or JSON files that contain the same data. Serverless SQL pool skips the columns and rows that aren't needed in a query if you're reading Parquet files. Serverless SQL pool needs less time and fewer storage requests to read it.
Reference: https://docs.microsoft.com/en-us/azure/synapse-analytics/sql/best-practices-serverless-sql-pool
https://stackoverflow.com/questions/65320949/parquet-vs-delta-format-in-azure-data-lake-gen-2-store
NEW QUESTION # 71
The group registers the Power Bl tenant as a data source1.
You need to ensure that all the analysts can view the assets in the Power Bl tenant The solution must meet the technical requirements for Microsoft Purview and Power BI.
What should you do?
- A. Create a scan.
- B. Create a linked service.
- C. Search the data catalog.
- D. Deploy a Power Bl gateway.
Answer: A
NEW QUESTION # 72
You open a Power Bl Desktop report that contains an imported data model and a single report page.
You open Performance analyzer, start recording, and refresh the visuals on the page. The recording produces
the results shown in the following exhibit
What can you identify from the results?
- A. When all the visuals refresh simultaneously, the visuals spend most of the time waiting on other processes to finish.
- B. Unoptimized DAX queries cause the page to load slowly.
- C. The Actual/Forecast Billable Hrs YTD visual displays the most data.
- D. The Actual/Forecast Hours by Type visual takes a long time to render on the report page when the data is cross-filtered.
Answer: A
NEW QUESTION # 73
You are optimizing a Power Bl data model by using DAX Studio.
You need to capture the query events generated by a Power Bl Desktop report.
What should you use?
- A. a Query Plan trace
- B. an All Queries trace
- C. the DMV list
- D. a Server Timings trace
Answer: B
Explanation:
Explanation
The All Queries trace in Dax Studio supports capturing the query events from all client tools (not just queries sent from DAX Studio like the Query Plan and Server Timings features do). The 'All Queries" trace is really useful when you wish to see the queries that are generated by a client tool like Power BI Desktop.
Reference: https://daxstudio.org/documentation/features/all-queries-trace/
NEW QUESTION # 74
You plan to a Power Bl dataset.
You open the Impact analysis panel for the dataset and select Notify contacts.
Which contacts will be notified when you use the Notify contacts feature?
- A. any users that accessed a report that uses the dataset within the last 30 days
- B. the Power Bl admins
- C. the workspace admins of any workspace that uses the dataset
- D. all the workspace members of any workspace that uses the dataset
Answer: D
Explanation:
Explanation
Notify contacts
If you've made a change to a dataset or are thinking about making a change, you might want to contact the relevant users to tell them about it. When you notify contacts, an email is sent to the contact lists of all the impacted workspaces. Your name appears on the email so the contacts can find you and reply back in a new email thread.
Reference: https://docs.microsoft.com/en-us/power-bi/collaborate-share/service-dataset-impact-analysis
NEW QUESTION # 75
You need to provide users with a reproducible method to connect to a data source and transform the data by using an Al function. The solution must meet the following requirement
* Minimize development effort.
* Avoid including data in the file.
Which type of file should you create?
- A. PBIDS
- B. PBIX
- C. PBIT
Answer: C
Explanation:
Explanation
A PBIT file is a template created by Power BI Desktop, a Microsoft application used to create reports and visualizations. It contains queries, visualization settings, data models, reports, and other data added by the user.
A PBIT file acts as a Power BI template. It doesn't include any data from your source systems.
Reference: https://docs.microsoft.com/en-us/power-bi/connect-data/desktop-data-sources
NEW QUESTION # 76
You are creating an external table by using an Apache Spark pool in Azure Synapse Analytics. The table will contain more than 20 million rows partitioned by date. The table will be shared with the SQL engines.
You need to minimize how long it takes for a serverless SQL pool to execute a query data against the table.
In which file format should you recommend storing the table data?
- A. Apache Parquet
- B. Delta
- C. JSON
- D. CSV
Answer: A
Explanation:
Prepare files for querying
If possible, you can prepare files for better performance:
* Convert large CSV and JSON files to Parquet. Parquet is a columnar format. Because it's compressed, its file sizes are smaller than CSV or JSON files that contain the same data. Serverless SQL pool skips the columns and rows that aren't needed in a query if you're reading Parquet files. Serverless SQL pool needs less time and fewer storage requests to read it.
Reference:
https://stackoverflow.com/questions/65320949/parquet-vs-delta-format-in-azure-data-lake-gen-2-store
NEW QUESTION # 77
You have a Power Bl dataset that contains the following measures:
* Budget
* Actuals
* Forecast
You create a report that contains 10 visuals.
You need provide users with the ability to use a slicer to switch between the measures in two visuals only.
You create a dedicated measure named cg Measure switch.
How should you complete the DAX expression for the Actuals measure? To answer, drag the appropriate
values to the targets. Each value may be used once, more than once, or not at all. You may need to drag the
split bar between panes or scroll to view content.
NOTE: Each correct selection is worth one point.
Answer:
Explanation:
NEW QUESTION # 78
You have the following code in an Azure Synapse notebook.
Use the drop-down menus to select the answer choice that completes each statement based on the information presented in the code.
NOTE: Each correct selection is worth one point.
Answer:
Explanation:
Explanation
Box 1: three scatterplots
Compare Plots
Example, Draw two plots on the same figure:
import matplotlib.pyplot as plt
import numpy as np
#day one, the age and speed of 13 cars:
x = np.array([5,7,8,7,2,17,2,9,4,11,12,9,6])
y = np.array([99,86,87,88,111,86,103,87,94,78,77,85,86])
plt.scatter(x, y)
#day two, the age and speed of 15 cars:
x = np.array([2,2,8,1,15,8,12,9,7,3,11,4,7,14,12])
y = np.array([100,105,84,105,90,99,90,95,94,100,79,112,91,80,85])
plt.scatter(x, y)
plt.show()
Result:
Chart, scatter chart Description automatically generated
Box 2: three marker symbols
One for each scatterplot. One default, and two defined.
Default is point.
v is triangle down.
^ is triangle up.
Reference: https://www.w3schools.com/python/matplotlib_scatter.asp
https://matplotlib.org/stable/api/markers_api.html
NEW QUESTION # 79
Note: This question is part of a series of questions that present the same scenario. Each question in the series contains a unique solution that might meet the stated goals. Some question sets might have more than one correct solution, while others might not have a correct solution.
After you answer a question in this section, you will NOT be able to return to it. As a result, these questions will not appear in the review screen.
From Power Query Editor, you profile the data shown in the following exhibit.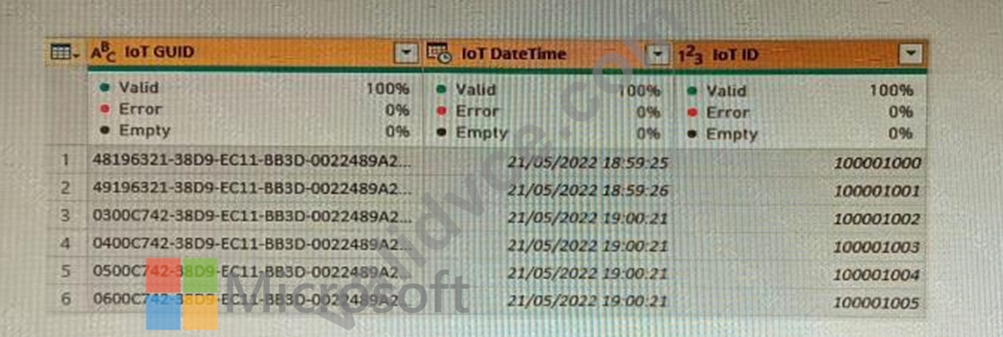
From Power Query Editor, you profile the data shown in the following exhibit The loT GUIO and loT ID columns are unique to each row in the query.
You need to analyze loT events by the hour and day of the year. The solution must improve dataset performance.
Solution: You remove the loT ID column and retain the loT GUID column.
Does this meet the goal?
- A. No
- B. Yes
Answer: B
NEW QUESTION # 80
You have a file named File1.txt that has the following characteristics:
* A header row
* Tab delimited values
* UNIX-style line endings
You need to read File1.txt by using an Azure Synapse Analytics serverless SQL pool.
Which query should you execute?

- A. Option C
- B. Option B
- C. Option A
- D. Option D
Answer: C
Explanation:
Explanation
Use FIELDTERMINATOR ='\t' for tab.
Use ROWTERMINATOR ='\0x0A ' for UNIX-style line endings
Use FIRSTROW= 2 for a header row
Note: Using Row Terminators
The row terminator can be the same character as the terminator for the last field. Generally, however, a distinct row terminator is useful. For example, to produce tabular output, terminate the last field in each row with the newline character (\n) and all other fields with the tab character (\t).
If you want to output a line feed character only (LF) as the row terminator - as is typical on Unix and Linux computers - use hexadecimal notation to specify the LF row terminator. For example:
bcp -r '0x0A'
FIRSTROW
FIRSTROW =first_row Specifies the number of the first row to load. The default is 1. This indicates the first row in the specified data file. The row numbers are determined by counting the row terminators. FIRSTROW is 1-based.
Reference:
https://docs.microsoft.com/en-us/sql/relational-databases/import-export/specify-field-and-row-terminators-sql-se
https://docs.microsoft.com/en-us/sql/t-sql/functions/openrowset-transact-sql
NEW QUESTION # 81
You are using Azure Synapse Studio to explore a dataset that contains data about taxi trips.
You need to create a chart that will show the total trip distance according to the number of passengers as
shown in the following exhibit.
How should you configure the chart? To answer, select the appropriate options in the answer area. NOTE:
Each correct selection is worth one point.
Answer:
Explanation:
NEW QUESTION # 82
Note: This question is part of a series of questions that present the same scenario. Each question in the series contains a unique solution that might meet the stated goals. Some question sets might have more than one correct solution, while others might not have a correct solution.
After you answer a question in this section, you will NOT be able to return to it. As a result, these questions will not appear in the review screen.
You have the Power Bl data model shown in the exhibit. (Click the Exhibit tab.)
Users indicate that when they build reports from the data model, the reports take a long time to load.
You need to recommend a solution to reduce the load times of the reports.
Solution: You recommend moving all the measures to a calculation group.
Does this meet the goal?
- A. Yes
- B. No
Answer: B
Explanation:
Explanation
Instead denormalize For Performance.
Even though it might mean storing a bit of redundant data, schema denormalization can sometimes provide better query performance. The only question then becomes is the extra space used worth the performance benefit.
Reference: https://www.mssqltips.com/sqlservertutorial/3211/denormalize-for-performance/
NEW QUESTION # 83
You manage a Power BI dataset that queries a fact table named SalesDetails. SalesDetails contains three date columns named OrderDate, CreatedOnDate, and ModifiedDate.
You need to implement an incremental refresh of SalesDetails. The solution must ensure that OrderDate starts on or after the beginning of the prior year.
Which four actions should you perform in sequence? To answer, move the appropriate actions from the list of actions to the answer area and arrange them in the correct order.
NOTE: More than one order of answer choices is correct. You will receive credit for any of the correct orders you select.
Answer:
Explanation:
Explanation
Graphical user interface, text, application, chat or text message Description automatically generated
Step 1: Create RangeStart and RangeEndDateTime parameters.
When configuring incremental refresh in Power BI Desktop, you first create two Power Query date/time parameters with the reserved, case-sensitive names RangeStart and RangeEnd. These parameters, defined in the Manage Parameters dialog in Power Query Editor are initially used to filter the data loaded into the Power BI Desktop model table to include only those rows with a date/time within that period.
Step 2: Add an applied step that adds a custom date filter OrderDate is Between RangeStart and RangeEnd.
With RangeStart and RangeEnd parameters defined, you then apply custom Date filters on your table's date column. The filters you apply select a subset of data that will be loaded into the model when you click Apply.
Step 3: Configure an incremental refresh to archive data that starts two years before the refresh date.
After filters have been applied and a subset of data has been loaded into the model, you then define an incremental refresh policy for the table. After the model is published to the service, the policy is used by the service to create and manage table partitions and perform refresh operations. To define the policy, you will use the Incremental refresh and real-time data dialog box to specify both required settings and optional settings.
Step 4: Add an applied step that filters OrderDate to the start of the prior year.
Reference: https://docs.microsoft.com/en-us/power-bi/connect-data/incremental-refresh-overview
NEW QUESTION # 84
After you answer a question in this section, you will NOT be able to return to it. As a result, these questions will not appear in the review screen.
You are using an Azure Synapse Analytics serverless SQL pool to query a collection of Apache Parquet files by using automatic schema inference. The files contain more than 40 million rows of UTF-8-encoded business names, survey names, and participant counts. The database is configured to use the default collation.
The queries use open row set and infer the schema shown in the following table.
You need to recommend changes to the queries to reduce I/O reads and tempdb usage.
Solution: You recommend defining a data source and view for the Parquet files. You recommend updating the query to use the view.
Does this meet the goal?
- A. Yes
- B. No
Answer: B
Explanation:
Explanation
Solution: You recommend using OPENROWSET WITH to explicitly specify the maximum length for businessName and surveyName.
The size of the varchar(8000) columns are too big. Better reduce their size.
A SELECT...FROM OPENROWSET(BULK...) statement queries the data in a file directly, without importing the data into a table. SELECT...FROM OPENROWSET(BULK...) statements can also list bulk-column aliases by using a format file to specify column names, and also data types.
Reference: https://docs.microsoft.com/en-us/sql/t-sql/functions/openrowset-transact-sql
NEW QUESTION # 85
You use the Vertipaq Analyzer to analyze tables in a dataset as shown in the Tables exhibit. (Click the Tables tab.)
The table relationships for the dataset are shown in the Relationships exhibit. (Click the Relationships tab.)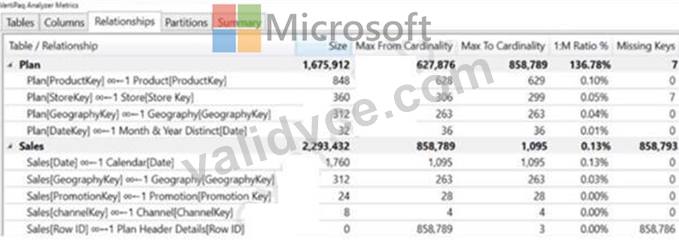
You need to reduce the model size by eliminating invalid relationships.
Which column should you remove?
- A. Sales[Sales ID]
- B. Sales[Sales Amount]
- C. Plan[RowlD]
- D. Sales[RowlD]
Answer: A
Explanation:
Explanation
Sales[Row ID] has 858,786 missing keys and 858,789 Max From Cardinality.
Note: The Max From Cardinality column defines the cost of the relationship which is the amount of time DAX needs to transfer the filters from the dimensions table to the fact table.
Reference: https://blog.enterprisedna.co/vertipaq-analyzer-tutorial-relationships-referential-integrity/
NEW QUESTION # 86
You have the Power BI workspaces shown in the following exhibit.
Use the drop-down menus to select the answer choice that completes each statement based on the information presented in the graphic.
NOTE: Each correct selection is worth one point.
Answer:
Explanation: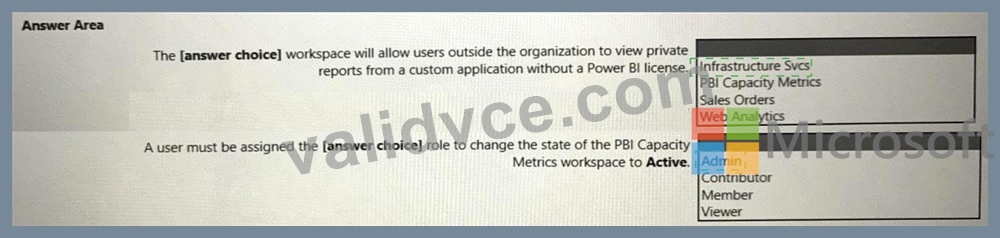
Explanation
Box 1: Infrastrucrue Svcs
Infrastrucrue Svcs is a Premium workspace.
If users have a free license and the workspace is stored in Premium (dedicated) capacity, they will be able to view and interact with the content in that workspace.
If users have a free license and the workspace is stored in shared capacity (not premium), they will not be able to see the content in shared workspace, only "My workspace".
If users have pro license, they will be able to view and interact with the content in that workspace.
Box 2: Admin
We need to activate the Orpaned workspace.
An orphaned workspace is one that does not have an admin assigned.
If you're a Service Admin, you can now view all of your organization's workspaces through the Admin Portal in the user interface.
Graphical user interface, table Description automatically generated with medium confidence
It's easy to Recover an orphan from this screen. Simply select the workspace and click Recover, then add yourself or another user as an admin.
Reference:
https://community.powerbi.com/t5/Service/Difference-between-Public-and-Private-workspace/m-p/1382219
https://docs.microsoft.com/en-us/power-bi/admin/service-admin-portal-workspaces
NEW QUESTION # 87
Note: This question is part of a series of questions that present the same scenario. Each question in the series contains a unique solution that might meet the stated goals. Some question sets might have more than one correct solution, while others might not have a correct solution.
After you answer a question in this section, you will NOT be able to return to ft. As a result, these questions will not appear in the review screen.
From Power Query Editor, you profile the data shown in the following exhibit.
The loT GUID and loT ID columns are unique to each row in the query.
You need to analyze loT events by the hour and day of the year. The solution must improve dataset performance.
Solution: You split the loT DateTime column into a column named Date and a column named Time.
Does this meet the goal?
- A. No
- B. Yes
Answer: B
NEW QUESTION # 88
You have a shared dataset in Power Bl named Dataset1.
You have an on-premises Microsoft SQL Server database named DB1.
You need to ensure that Dataset1 refreshes data from DB1.
Which three actions should you perform in sequence? To answer, move the appropriate actions from the list of actions to the answer area and arrange them in the correct order.
Answer:
Explanation:
1 - Install the on-premises data gateway (standard mode)
2 - From powerbi.com, add a data source to the gateway clusters
3 - From powerbi.com, configure Dataset1 to use a data gateway.
Reference:
https://docs.microsoft.com/en-us/power-bi/connect-data/service-gateway-sql-tutorial
https://docs.microsoft.com/en-us/power-bi/connect-data/service-gateway-enterprise-manage-sql
NEW QUESTION # 89
You need to configure a source control solution for Azure Synapse Analytics. The solution must meet the following requirements:
* Code must always be merged to the main branch before being published, and the main branch must be used for publishing resource
* The workspace templates must be stored in the publish branch.
* A branch named dev123 will be created to support the development of a new feature.
What should you do? To answer, select the appropriate options in the answer area.
NOTE: Each correct selection is worth one point.
Answer:
Explanation:
NEW QUESTION # 90
You have a Power Bl tenant
You invite an external consultant to work in the tenant.
You need to grant the consultant access to the tenant. The solution must meet the following requirements;
* The consultant must be able to consume, create, and update reports and datasets.
* The consultant must access content by using Azure AD B2B.
Which settings should you enable in the Power Bl Admin portal? Each correct answer presents part of the solution.
NOTE: Each correct selection is worth one point.
- A. Allow Azure Active Directory guest users to edit and manage content in the organization
- B. Invite external users to your organization
- C. Allow Azure Active Directory guest users to access Power Bl
- D. External sharing
Answer: A,C
NEW QUESTION # 91
......
100% Reliable Microsoft DP-500 Exam Dumps Test Pdf Exam Material: https://www.validvce.com/DP-500-exam-collection.html
Current DP-500 dumps Preparation through Our Practice Test: https://drive.google.com/open?id=1N8M2KbuoFlcw190YxfB_8L4aOUNSzV9j
